My Wave Accessibility Report:
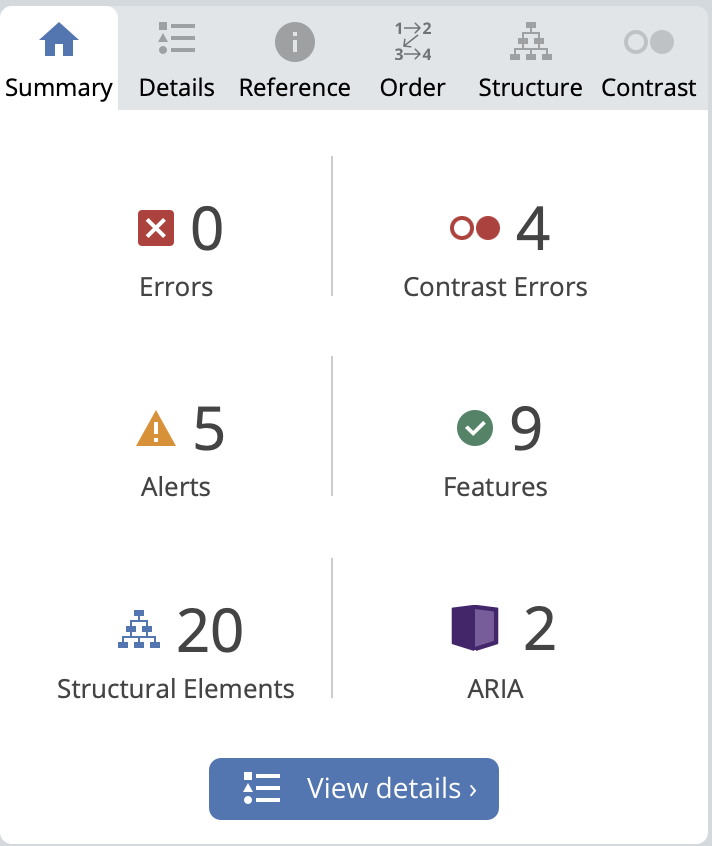
When I ran my WAVE accessibility report for my WordPress site as shown in the figure it came up with contrast errors, alerts, features, structural elements, and ARIA. I was surprised to find that when I explored the contrast errors they were to do with aspects that the site already had including the bar under headings that has my username, the date, and comment count and also the links which are automatically in a teal colour were also considered contrast errors. After observing this I am going to try to make it so those parts of the blog have a darker colour so that all of my viewers and classmates who read my blog can see all the information included. The alerts were all to do with the links in my website the first was for my pod reflection being a PDF and they wanted to make sure it was easily accessible, the second was to do with my screencast link the alert was because I did not add a transcript to my video making it inaccessible to those with hearing impairments. The last three alerts were because of redundant links which were from clicking on my username “ELLAGILBERT5” and it being under every heading and bringing them back to the website they are already on. After seeing these alerts I will definitely be adding transcripts to any video or audio clips I add to my blog to make sure it is accessible to everyone. Another thing observed in my WAVE report is a large number of structural elements which helps the viewers navigate the website with ease. Keeping all these elements in mind moving forward I will continue adding subheadings for navigation ease, attempt to change the lighter fonts to darker colours to decrease the contrast errors, and attempt to add transcripts over any video clips worth audio to make it accessible to all viewers.
Text to Speech Tools Exploration
I before this course have only really used text to speech tools if they were offered as a feature on my online textbooks because I find it easier to take notes while listening rather than reading and trying to multitask both. I find it useful in academic environments when the information they are reading does not necessarily require different tone to help with context but find when it is something more conversational like our blog posts it loses some meaning being read so monotone. After trying some of the different voices out I found it sort of distracting to use some of the ones with accents, being from a small town in Canada I did not have a lot of exposure to different accents so I found it harder to understand which took my focus away from the material. I would say overall as mentioned in my module one blog post the principles of voice and personalization have a large effect on my ability to keep interested and focused so I do not find text to speech to be that useful of a tool for myself.
Inclusive Design: What Does it Mean to Me?
As my WAVE report laid out for me one feature of inclusive design is accessibility for those with different impairments. The contrast errors make my blog less accessible to those with visual impairment and my screencast being without transcripts makes it less accessible to those with hearing impairments. Inclusive design to me does not only include accessibility for everyone no matter their abilities but it also means representation in design. For example, if you are doing a project on Indigenous material for school I believe there should be an element or two of Indigenous language or art to be inclusive and representative of the culture you are talking about. Inclusivity to me is a balance of accessibility, representation, and having ways to accommodate all different people.
My Infographic and Design Principles Used
When creating my infographic after reading over the design principles I focused on alignment, I used contrasting colours, and left lots of negative space so it was easy to see from near or far. As far as relating my elements back to the video on making a good infographic I kept my infographic very practical, well structured to each point, and I kept it very straight to the point “short and sweet” as said in the video. Keeping my infographic extremely simply helped add to the cohesive look of it and helped keep the information organized. Along with that I also kept in mind the idea of cognitive overload which was easier to decrease with a simple design and using lots of negative space. I personally am not the most creative person so the templates definitely help with the visual appeal and they can help inspire me for different designs but I can make them and add my own spin. Though they do help with creativity templates can also be a disadvantage in that you might not get to see your exact vision come to life and it may not fit the topic as much as if you personally designed it.
Leave a Reply